


Cross Tabs + Cohen's kappa
Cross Tabs
Description
Cross-tabulation (Cross Tab for short) is a way to display and describe the relationship between two categorical variables using a table. Cross tabs can represent two variables only, one on each axis of the table, but each variable may display multiple categories, with each cell within the table representing the resultant combination of the variables.
Benefits
Cross-tabulation helps compare differences between groups and provides an effective method of visualisation.
Drawbacks
As this only evaluates two variables at a time, having multiple variables may lead to many tables due as different variable combinations are analysed. Usefulness of each combination/analysis might not be apparent until analysis is completed.
Worked Example
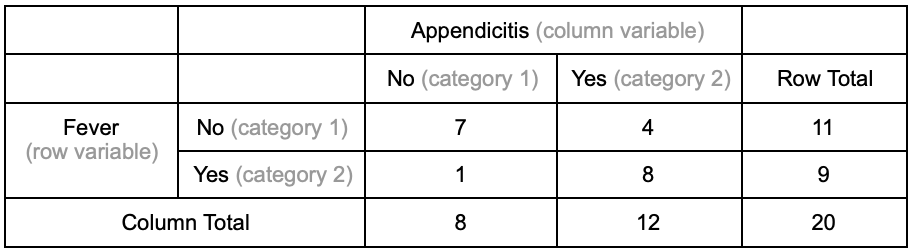
An example cross-tab is provided here to evaluate the presence of fever in patients with and without appendicitis.

Download the example Excel file
- Open example Excel file
- Two columns are set up to indicate whether the person has appendicitis and whether they have a fever
- Both are categorical variables with a ‘Yes’ or ‘No’ value
- Performing a cross-tab here will help understand the data in different ways
- This includes how common fever is in appendicitis
- But also how common is appendicitis amongst those with fever
- Select Analyse link above
- Browse and upload the Excel file
- Note that you must choose file type (.xlsx or .csv) as appropriate
- .csv files also need you to define your separator
- Select the ‘The first verse is label’ if you have included column headings
- Select the variables that you would like to include in your analysis
- In this situation, include both appendicitis and fever
- Define the variables for both row and column (may take some time to load)
- Specify which variable you would like as the row and column
- Various tabs are available to view the statistical output on the top
- Cross-tab results will be displayed under ‘CrossTab’
- ‘Chi Squared’ and ‘Fisher’ indicate the association between the categorical variables
- ‘Kappa’ will be explored in a separate page
- Results
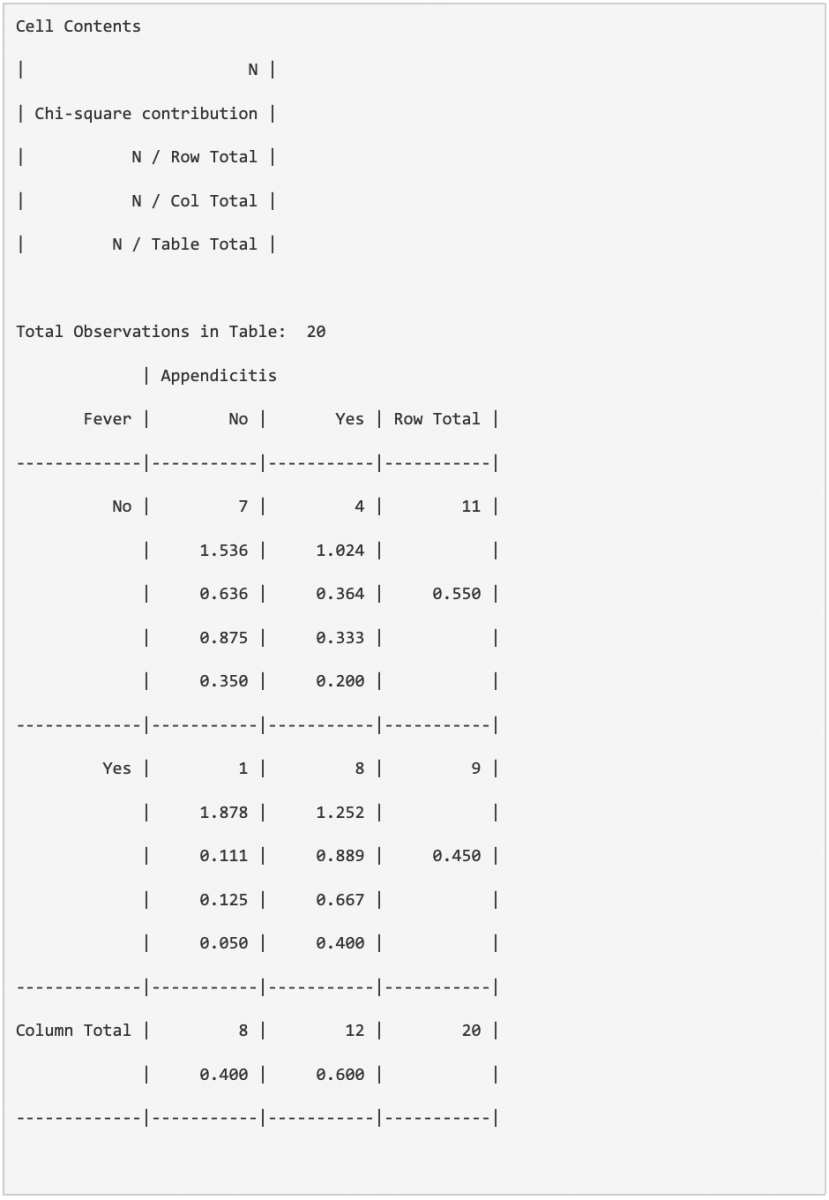
- Interpretation
- Cell Contents explains what each value represents in each cell
- The above table uses N for each observation
Cohens Kappa
Description
Cohen's Kappa (κ) is a test that can be done on categorical data to measure inter-rater agreement between two raters. Cohen’s Kappa ranges from -1 to 1. The κ value generated from this test represents how well the raters’ scores relate to one another. The responses/ratings being analysed must be on a nominal scale, and the categories must be mutually exclusive.
κ = -1 suggests that the two raters are definitely in disagreement.
κ = 0 suggests the raters share no significant agreement or disagreement and thus any agreement is due to random chance.
κ = 1 suggests the two raters are definitely in agreement.
In terms of statistics in a study, 0 means that the rating method is different between the raters and sees agreement in results by chance, while 1 means that the rating method is methodical and completely competent so that all agreements between raters are not by chance.
Benefits
The test is relatively simple to use and takes into account guessing during data collection/rating.
Drawbacks
Cohen’s Kappa can be deemed substantial and significant at low levels of agreement despite large amounts of disagreement existing. If the kappa value is at 70%, it would likely be considered substantially agreeable, yet 30% of the data is disagreed on. This can lead to implementations based on partially faulty data. Another drawback is that Kappa makes assumptions about independence between raters which might not always be justified. It is also important to note that inter-rater agreement does not equal to the objective truth or ‘correct’ rating.
Worked Example
As with many other statistical tools, Cohen’s Kappa can be used on information displayed in cross tabulations/contingency tables. The example here will evaluate the inter-rater agreement in measuring the temperature of a patient.
Download the example Excel file
- In the file there are two columns of measurements of whether a fever is identified
- The different columns represents measurements by the two investigators
- Open rBiostatistics >> Agreement >> Cohen's kappa >> Analyze
- Browse and upload the Excel file
- Note that you must choose file type (.xlsx or .csv) as appropriate
- .csv files also need you to define your separator
- Select the ‘The first verse is label’ if you have included column headings
- Select the variables you would like to include in your analysis
- Define the variables for both row and column
- Specify which variable you would like as the row and column
- Various tabs are available to view the statistical output on the top.
- Cohen's Kappa results can be found under the tab labelled Kappa.
- Cohen's Kappa results can be found under the tab labelled Kappa.
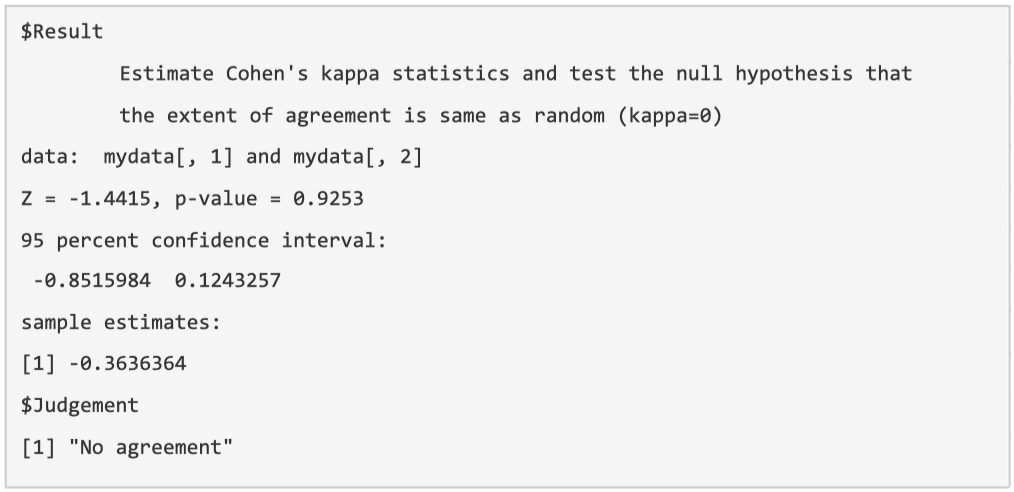
- Results
- κ (displayed as ‘sample estimate’) = -0.3636
- 95% Confidence Interval = -0.8516 - 0.1243
- P-value = 0.9253
- Judgement = Simplified interpretation of the results
- Interpretation
- The value of -0.364 implies there is more disagreement than agreement between the two nurses in diagnosing fever.
- Confidence interval crosses 1 and p-value > 0.05 , meaning it is not statistically significant and that observed differences may be due to randomness.
- In short, the inter-rater difference agreement is mildly negative but the differences are not statistically significant.
Written by Ka Siu Fan & Ka Hay Fan