


ROC summary data
Description
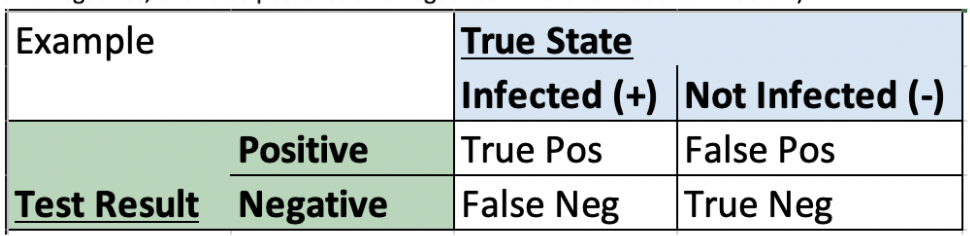
The previous section ROC Curve Raw Data describes how to measure the diagnostic value of a test by analysing the relationship between sensitivity and specificity for each cut off value. This is used to determine the value at which you can obtain the highest true positive rate and lowest false positive rate for a biomarker (e.g. CRP cut-off values for suspicion of appendicitis). ROC summary uses a confusion matrix, which is a 2x2 table that reports the outcomes of a test compared to their true state. This produces four values within the table : True positive and negatives, and false positives and negatives - in the format shown below).
ROC Summary considers the summary observations obtained from a single study (i.e from one confusion matrix) to quickly determine characteristics such as Sensitivity, Specificity, Positive Predictive Value, Likelihood ratio and Accuracy.
| Sensitivity |
Proportion of true positives who have a positive result from the diagnostic test. Sensitivity = true positives/(false negatives + true positives) |
| Specificity |
Proportion of true negatives who have a negative result from the diagnostic test. Specificity = true negative/(false positives + true negatives) |
| Positive Predictive Value |
The proportion of subjects with a positive test result who have the disorder. PPV = (true positive/true positive + false positives)x100% |
| Negative Predictive Value |
The proportion of subjects with a negative test result who do not have the disorder. This is the ability of the test to sieve out people who are low risk. NPV = (true neg/true neg+false negatives) x100% |
| Likelihood Ratio |
The likelihood of result being found in a person with a disorder compared with that of a person without the disorder. LRR positive result = sensitivity / (1-specificity) LRR negative result = (1-sensitivity)/specificity |
Benefits
Can be used as a quick tool when looking at the information from summary data in a published article or clinical data to identify characteristics such as Sensitivity, Specificity, Positive Predictive Value, Likelihood ratio and Accuracy. This can then be used to determine clinically relevant information such as number needed to treat.
Limitations
Need to prepare the data beforehand into a 2x2 confusion matrix with True positive, False positive, True positive and False positive. May be time consuming to do this with a number of different tests (in which case using ROC Raw may be more helpful).
Worked Example

Download the example file 'ROC_summary_data.xlsx'. In this example you will see the Example 2x2 shown above as well as confusion matrices for 3 different rapid diagnostic tests (Rapid Test A, B and C). Each 2x2 test data are outcomes when different testing kits were used on a cohort of 300 different patients with symptoms suggestive of an infective disease. The true state was confirmed by gold standard which accurately determined the each individuals true infected/not infected state.
Instructions
- Go to rbiostatistics.com → Biostatistics → ROC → ROC summary Data
- Click Analyze
- Input the data from rapid test A (TP = True positive, FP = False positive, TN = True negative, FN = False Negative)
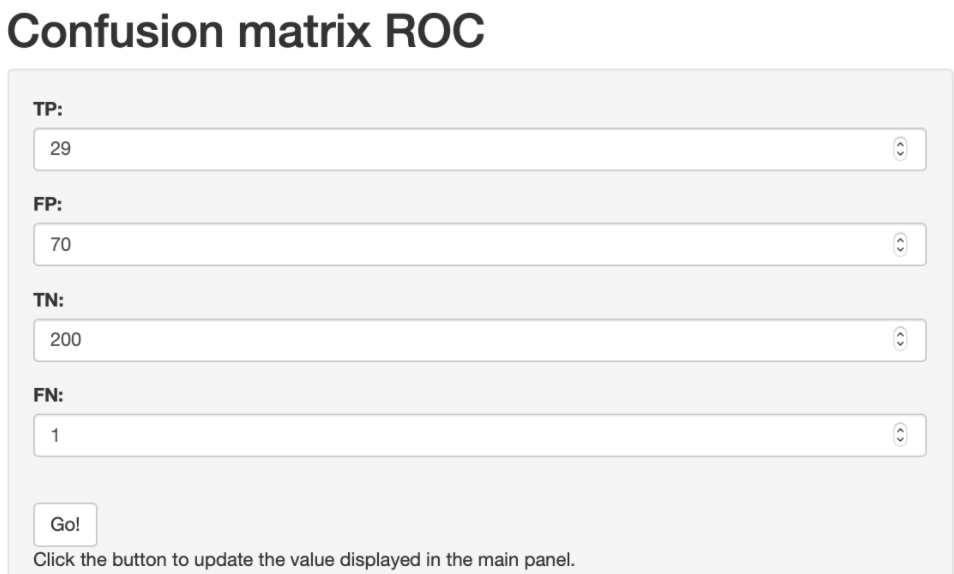
- Click Go!
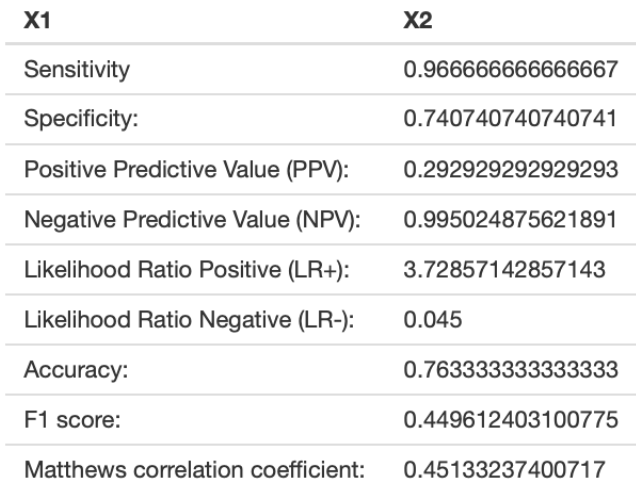
- Obtain the results of interest from the table:
Written By Shahi Ghani
Reviewed by Kevin Mitchell