


ROC raw data
Description
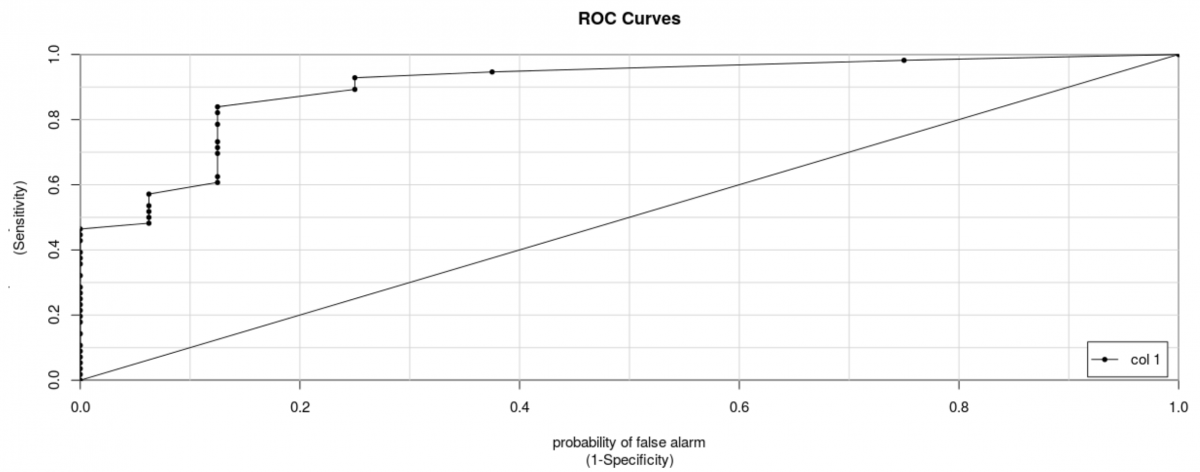
Receiving Operating Characteristics (ROC) curve is a plot of false positive rates against true positive rates from the results of a test. Area Under the Curve (AUC) value calculated from the ROC curve measures how well a test can tell the difference between the presence or absence of a condition by comparing its sensitivity (true positive rate) and 1-specificity(false positive/type 1 error rates). Further explanation and application of ROC and AUC will be described in an example below.
The Youden index is also calculated. This adds specificity and sensitivity together and provides a simple way of identifying a good cut off point that maximises sensitivity and specificity. Greater Youden index values are better as this means the cut off is more specific and sensitive to errors.
Benefits
Commonly used method to measure the diagnostic value of tests/tools. Easy to use and is utilised across many fields outside of medicine to evaluate tests/tools.
Drawbacks
Requires background knowledge of disease and implications of test uses and purposes to decide on a useful cutoff. Ideally, if the cost of diagnosis and condition prevalence is known, you select a cut off which minimises cost.
Analyse Multiple set of prediction
Analyse one set of prediction(upload csv)
Analyse one set of prediction(upload xlsx)
Confusion Matrix (upload xlsx)
Worked Example

Download the above example Excel file ‘ROC Raw’. The example here looks at the diagnostic value of CRP as an indicator of appendicitis. The CRP levels of those with and without appendicitis (confirmed by histology) are recorded.
In the file, there are two headed columns:
- The level of CRP
- Whether the person has appendicitis or not
Instructions
- Open rBiostatistics >> ROC>> Raw Data >> Analyse one set of prediction(upload xlsx)
- Browse and upload the Excel file
- Select the variable you would like to include in your analysis (CRP and appendicitis)
- Define the variables for both row and column
- Binary - appendicitis
- Continuous - CRP
- Select event - Yes (data was structured to indicate appendicitis with ‘Yes’)
- Various tabs are available to view the statistical output on the top
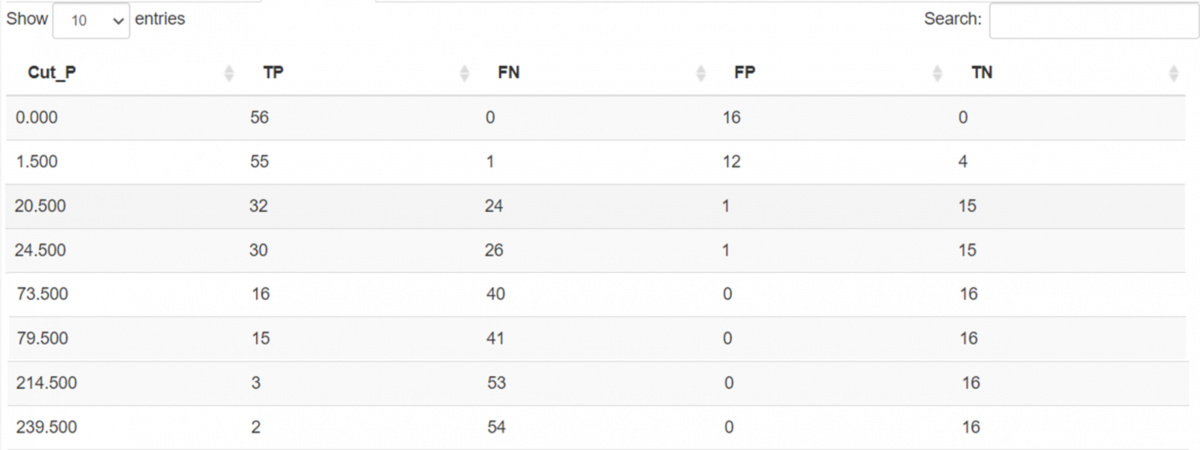
- ‘Cut points’ tab displays the data in relation to the cut-off
- TP: True Positive
- FN: False Negative
- FP: False Positive
- TN: True Negative
- ‘General’ tab shows sensitivity, specificity and the Youden index
- ‘Plot’ tab shows the ROC curve itself
- ‘Cut points’ tab displays the data in relation to the cut-off
- Results
- Interpretation
- Youden index of this sample dataset suggests a CRP cut off of 6.5 for CRP to receive maximal sensitivity and specificity.
- We select the cutoff point on the curve closest to the top left corner (where sensitivity and specificity are highest).
- AUC
- AUC describes how the well the curve points towards the left upper corner of the plot. The further away from the diagonal line the better the test is.
- An AUC value of 0.5 means that true and false positives are equal in occurrence and that the test does not discriminate between them
- An AUC of 1 means a perfect ability to discriminate
- In our example, The probability that the CRP level of someone with appendicitis is greater than a random person from sample.
- However, the selection of cut off points will depend on the purpose.
- For example, to rule out appendicitis using CRP, one would identify the minimum CRP cut off that achieves the maximum true histological negative
- Which is a CRP cut off of 43.5 in this situation
- In other words, a cut off of 43.5 will ensure all without appendicitis will be identified
- For example, to ‘confirm/diagnose’ appendicitis using CRP, one would identify the minimum CRP cut off that achieve the maximum true histological positive
- Which is a CRP cut off of 0.0 in this situation
- In other words, a cut off of 0 will ensure all appendicitis to be captured
- The presence of false positives and false negatives should also be taken into account as they also impact on the utility of the investigation and how the cut off is decided
- For example, to rule out appendicitis using CRP, one would identify the minimum CRP cut off that achieves the maximum true histological negative
- Youden index of this sample dataset suggests a CRP cut off of 6.5 for CRP to receive maximal sensitivity and specificity.
Written By Ka Hay Fan and Ka Siu Fan
Analyse Multiple set of prediction
Analyse one set of prediction(upload csv)
Analyse one set of prediction(upload xlsx)
Confusion Matrix (upload xlsx)
Resources
https://www.real-statistics.com/descriptive-statistics/roc-curve-classification-table/roc-curve/
https://towardsdatascience.com/understanding-auc-roc-curve-68b2303cc9c5
https://towardsdatascience.com/understanding-auc-roc-curve-68b2303cc9c5